This year I got involved with the Buzzards Bay Coalition: "a membership-supported nonprofit organization dedicated to the restoration, protection, and sustainable use and enjoyment of our irreplaceable Bay and its watershed." I moved to the south coast of Massachusetts in 2011, and now spend a good deal of time on the bay, at its beaches or kayaking, rowing, and sailing its waters. Given my enjoyment of nature, interest in cultural ecology, commitment to community service, and personal stake in the health of my watershed, getting involved seemed like a no-brainer. So, I joined the Coalition as a sustaining member, and began to volunteer my time helping to monitor water in the bay and its tributaries.
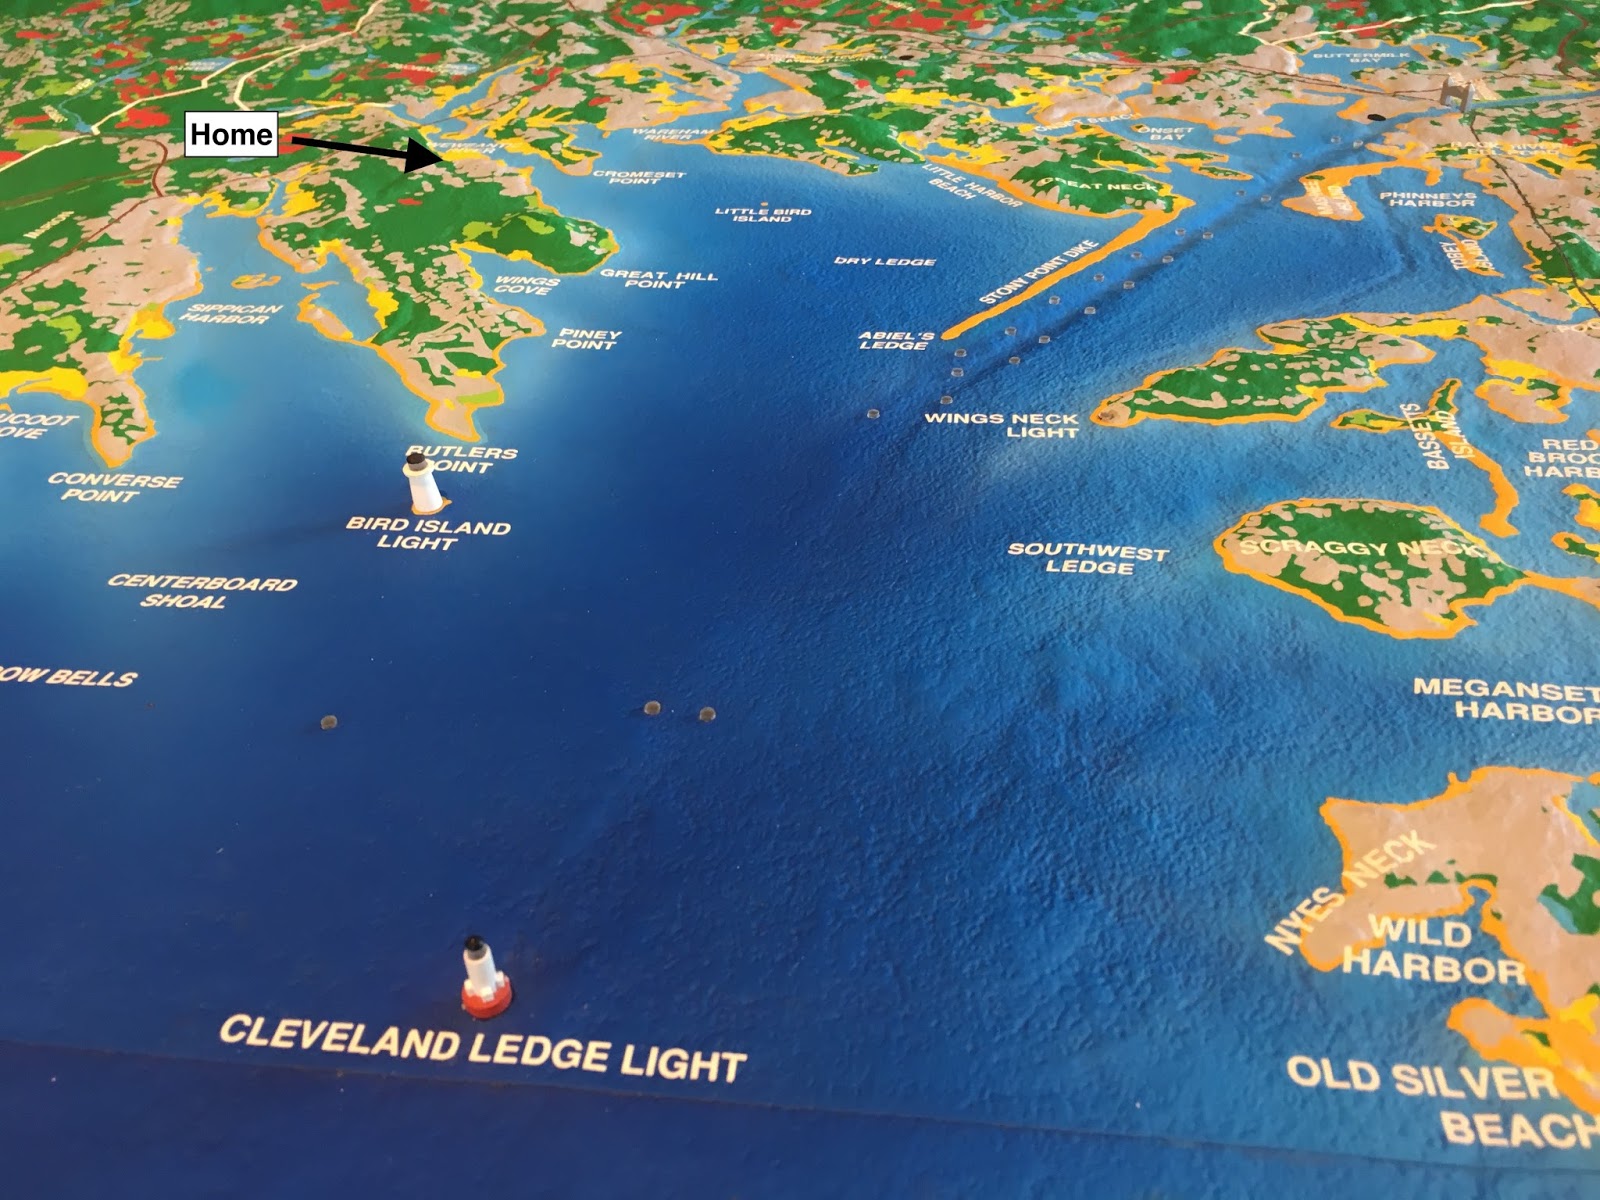
My Side of the Mountain: The upper reaches of Buzzards Bay, where I sail most frequently.
Marion is in the upper left, near Bird Island Light. Our home is on Sippican Neck, very close to the Weweantic River,
Marion is in the upper left, near Bird Island Light. Our home is on Sippican Neck, very close to the Weweantic River,
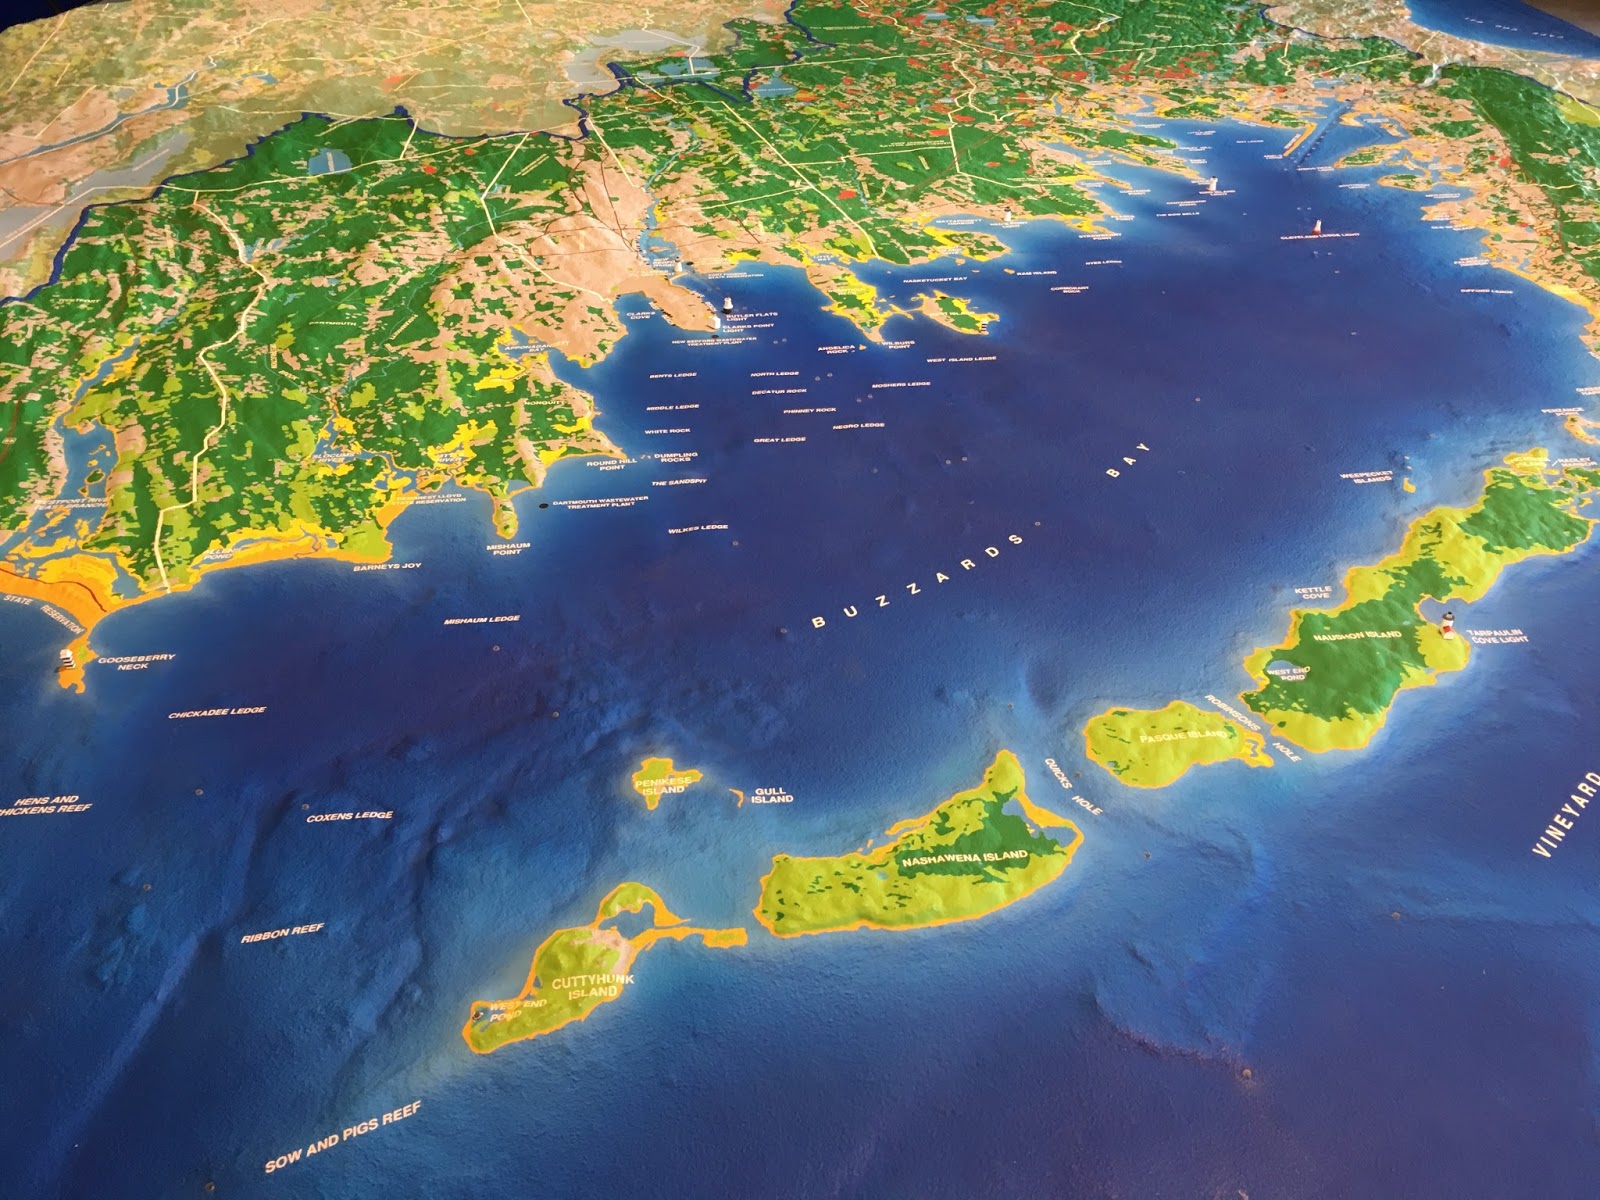
Buzzards Bay is a moderately large estuary, covering about 240 square miles, between Cape Cod and Rhode Island Sound. Roughly thirty miles long and ten miles wide, it sports more than 350 miles of coastline, including over a dozen miles of pretty nice beaches. During summer months, some 13,000 recreational boats are docked or moored here, while many more large commercial ships transit the bay throughout the year, enroute to and from the Cape Cod Canal -- the widest sea-level canal in the world -- saving a 135-mile trip around the Cape. More than 400,000 people live in the immediate region, about ten percent of them in New Bedford.

Buzzards Bay
Newbies to the region often look in vain for its namesake vultures. Actually, Buzzards Bay is a bit of a misnomer. European colonists to these shores mistook the large birds of the region as buzzards, when in fact they were osprey. Similar to Bald Eagles, Red-Tailed Hawks, and Turkey Vultures, Osprey are large and distinctively-shaped hawks, generally whiter (especially from below) than most raptors. Their wings, which can span more than seventy inches, have a kink that makes a distinctive 'M'-shape in flight, when seen from below. Also known as the "Fish Hawk" or "Sea Eagle," these piscivores subsist on a diet of fish, diving feet first into the water with their long legs to catch prey. You can hear sound recordings of osprey at the website of the Cornell Lab of Ornithology (which also offers an excellent smartphone app: Merlin Bird ID). Osprey usually mate for life, and are often depicted as a symbol of fidelity and spousal harmony. They feature in the 'Guan Ju' (關雎), one of the most famous poems in Chinese literature (dated to the seventh century BCE) and the opening selection in the ancient Classic of Odes.

The "fish hawk," with its distinctive M-shaped wing-in-flight
Most people know about Buzzards Bay for other reasons. The clock-like consistency of its afternoon southwesterly sea breeze generates the choppy waters for which its is so well known. Folks say that if you can learn to sail in Buzzards Bay, you can sail anywhere. I'm not so sure about that, but I would like to put that theory to the test one day.

Typical conditions for an afternoon sail on Buzzards Bay.
(Actually, that is Drake Passage, south of Cape Horn, on my Bucket List)
The port of New Bedford (pop. 95,000), was once the whaling capital of the world -- and is still home to one of the largest fishing fleets in the US, for years ranked first in terms of dollar-value landed (Dutch Harbor, AK, ranked second, lands more pounds of seafood). Our rowing club, 'Whaling City Rowing,' docks its whaleboats at a marina on Pope's Island, in the middle of the Achusnet River, between New Bedford and Fairhaven. The first naval engagement of the Revolutionary War, the Battle of Fairhaven, took place off these shores -- you can listen to a YouTube narration of the incident here. Admiral Wife grew up here, daughter of a fisherman. We now live a few miles up the coast, in Marion, near the head of the bay.

Buzzards Bay, circa 1909
It might be worth noting that one of only three fatal shark attacks in Massachusetts occurred in Buzzards Bay, but that was way back in 1936. Nevertheless, the resurgence in recent years of white sharks around Cape Cod, attracted to seal colonies, has become a growing concern of many local residents, Admiral Wife included. If I play my cards right, this may be a way to gain her support in my aspirations to move up to a bigger boat.
We use several smart phone apps, such as 'Shark Tracker' by Ocearch, and 'Sharktivity,' to keep tabs on recent shark sightings and satellite tag "pings." Of course, these reveal only a small number of sharks out there.
We also really enjoy this beer....
I find Buzzards Bay a really pleasant place to live, and so do many other species. The bay and its watershed offer a variety of diverse habitats, from forests and farms to cranberry bogs and herring runs, salt marshes, tidal flats, and eelgrass beds.

Scallop amid eelgrass....
Beds of eelgrass -- a blooming underwater grass, or angiosperm, not a seaweed -- form extensive meadows in many coves and estuaries. Growing to lengths of up to three feet, eelgrass beds are highly productive communities that provide habitat, shelter, nursery, and feeding ground for fish, waterfowl, and invertebrates (especially bay scallops). Eelgrass also plays an important role in filtering runoff and absorbing nutrients such as nitrogen and phosphorus, and protecting coastlines by absorbing wave energy. It used to be harvested as insulation and packing material -- and here's a trivia point: it was once used to stuff the seats in early model Volkswagens. Sensitive to pollution, eelgrass is an important "indicator species" for water quality changes in the bay.

Two of the largest colonies of the endangered Roseate Tern nest in Buzzards Bay, including one on the appropriately-named "Bird Island" in Marion.
Buzzards Bay was formed about 12,000 years ago, around the end of the Last Ice Age. Lands to its southern side -- including the Cape and Islands -- feature relatively smooth shorelines of sand and gravel particles: remains of depositions along the leading edge of the glacier. The northern side of the bay, by contrast, has many elongated bays and inlets formed by the glacier's retreat. That's where we live.

Vestiges of the last ice age
This is a semi-enclosed, tide-dominated estuary system. Rivers that feed into the bay are relatively short and generally slow-moving, while the bay itself is sheltered from larger open-ocean waves by the Elizabeth Islands. Tidal currents and winds are the primary circulation forces, and prevent any strong thermal stratification in these rather shallow waters (average depth is only 36 feet). Every ten days or so there is a complete mixing of ocean water and bay water, making for a productive aquatic ecosystem.
Roughly a dozen coastal communities share Buzzards Bay, while all or part of several more lie within the surrounding watershed, which covers over 400 square miles. Unfortunately, over the last half-century, development and intensified land use practices have put considerable stress on the bay. Nutrient run-off has lead to eutrophication of the waters, while bacteria and toxic wastes have taken a toll on water fowl, aquatic plants and animals, and general water quality.

Buzzards Bay Watershed
In the 1980s, local residents began to notice a marked decline in the health of the bay. Its once clear waters had become murky with algae growth due to nitrogen pollution. Once bountiful scallops and oysters declined, and many shellfish beds were closed due to bacterial contamination. Significant toxic pollution (including PCBs) plagued New Bedford and Upper Cape Cod. In 1984, Congress recognized Buzzards Bay as one of four 'Estuaries of National Significance,' and allocated funds to develop a long-term plan for protecting and restoring the waters and wildlife of the watershed. This 'Buzzards Bay Project' eventually became the Buzzards Bay National Estuary Program, an advisory and planning unit of the Massachusetts Office of Coastal Zone Management, part of a network led by the U.S. Environmental Protection Agency.

Beaches of Buzzards Bay
A few years later, the "Buzzards Bay Coalition" was established as a non-profit citizens advocacy group. In collaboration with the NEP and the Woods Hole Oceanographic Institute, the Coalition established an award-winning Citizens' Water Quality Monitoring Program, which recruits a corps of volunteer "Baywatchers" to collect data once a week on key indices of the watershed's health from some 200 monitoring stations in harbors, coves, and rivers in Buzzards Bay. That's where I come in...

Saving Buzzards Bay, one dissolved oxygen sample at a time....
As part of the largest and longest-running volunteer-based coastal monitoring effort in New England, once each week, early in the morning, I strap on my chest waders and head off to collect water samples from the Weweantic River. This is "close to home:" we live a few hundred meters from the western banks of the river, we kayak along the river, and moor the sailboat on the river.

My sampling station on the Weweantic River, just south of the Rt. 6 Bridge between Marion and Wareham
The 'Wandering River' (Weweantit in Wanpanoag) is a 17-mile long meandering river that rises in Carver and flows through Rochester and Wareham on its way to Buzzards Bay. This is the largest river watershed within the Buzzards Bay basin, covering roughly 18,000 acres, and the river contributes more than 13% of the freshwater that flows into the bay. Historically, the Weweantic had abundant fish and shellfish, but in the early 20th century cranberry bogs and mill pond dams blocked the river in several locations and the herring and alewives diminished. Near the mouth of the river, scallops and oyster used to abound, but their numbers have dropped precipitously in the last half century. The Weweantic -- especially its upper portion -- ranks among the most nutrient-polluted rivers in Massachusetts. Some of the biggest challenges being nitrogen seepage from residential septic systems (few abutting neighborhoods have sewer systems), and nitrogen and phosphorus discharge from cranberry bogs.

The tannin-rich brown waters of the Weweantic, showing Dexter's Cove where my boat is moored and my assigned sampling station for water quality monitoring near the Rt. 6 Bridge (photo: Maine Imaging)
Baywatchers like myself are issued a sampling kit and tasked with recording general weather conditions and collecting samples for water quality analysis. On designated dates, we head off to our assigned station to note whether the tide is ebbing or flooding, the time of nearest low tide, wave conditions (on the Beaufort scale), wind direction, weather conditions (Cloudless, Partly Cloudy, Overcast, Fog/Haze, Drizzle, Snow, or Rain), and precipitation in last 24-hours (none, light, or heavy). We then draw water samples to take measurements for temperature, turbidity, salinity, and dissolved oxygen.

My water quality monitoring kit at my sampling station on the Weweantic near the Rt. 6 bridge
Turbidity
The first thing I do is to wade out into the water, chest deep, and deploy a Secchi Disk. This simple device helps to create a measurement of water turbidity. Clarity and light availability serve as proxy measures for productivity in a water column. High turbidity can block penetration of light, with consequences for photosynthesis and production both in the water column as well as on the bottom. Scientists use our measurements to assess whether changes in turbidity might be due to over-production or to resuspension of bottom sediments (from physical circulation or from activities such as boat traffic). Using these data, people much smarter than me try to get a better grasp of the relative impact on water quality of direct and indirect activities -- say, boating versus housing development. The goal is not to impede or prevent "development," but rather to make informed choices about our actions and their consequences for the ecosystems in which we ourselves live.

As I lower the weighted 30cm plate into the water, the black and white markings eventually become obscured. I note the depth at which it "disappears" as a measure of turbidity. Then I lower the disk to the river bed and record total depth at my sample site.

Descending into the murky depths of the tannin-rich waters of the Wewantic....
Drawing Water Samples
Next, I fetch the sampling pole and return to the water a few meters upstream of my Secchi measurement. The pole is annotated with marks (every 5 cm) for depth measurement, and holds two plastic bottles with stoppers attached to strings that run up to the top of the pole. Since my sampling site is relatively shallow -- less than 1.2 meters deep -- I collect water samples from near the river bottom, some 30cm (about one foot) up from the bottom. Deeper sampling sites require a bottom sample and a surface sample. First I fill the smaller, 0.5-liter, bottle (red string) to sample for dissolved oxygen. Once that fills, and the air bubbles released have dissipated, I pull the white string to fill the larger 1-liter bottle and collect a water sample for salinity measurements. I bring the sampling pole and its water-filled bottles back to shore for immediate analysis.

Temperature
One of the easiest things I do is to take a reading of water temperature using a digital thermometer. In shallow embayments with more restricted circulation, summer water temperatures can be several degrees warmer than coastal waters. Warmer waters make oxygen less soluble, and also stimulate respiration (which consumes oxygen), so water temperature is a vital variable to record. This helps to estimate whether changing oxygen conditions (see below) are the result of physical mechanics of gas solubility, biological production, or alterations in nutrient conditions.

Taking a temperature reading of the water sample in the 1-liter salinity bottle
Salinity
I also measure the salinity/specific gravity of the water sample. Colder water is denser (and heavier) than warmer water, and saline water is denser than fresh water. There is a relationship between these three variables (salinity, temperature, and density), so if you know two values you can determine the third. By measuring the temperature and concentration of dissolved salts in water at any given depth, you can determine the density of the water. If you are feeling ambitious, you can then compare that to density at other depths. In a poorly mixed system, there is often a strong vertical gradient of salinity across different depths: a "stratified" water column, in which bottom waters will be more isolated and stressed with lower concentrations of oxygen. The ecological effects of density stratification are particularly significant in nutrient-rich coastal environments, where production of organic matter by plants and phytoplankton is high. Here there are high rates of oxygen consumption or depletion at night (when photosynthesis ceases), and as organic matter decays.

To measure salinity, I fill a 500ml graduated cylinder with a water sample from the larger 1-liter "salinity" bottle. Then I carefully place an easily-breakable hydrometer into the graduated cylinder.

Oops.....
After waiting for the bobbing hydrometer to stabilize, I record the reading from the gradient markings on its delicate neck.

After rising and returning the hydrometer to its PVC tube carrying case, I insert the digital thermometer and record the temperature of the water in the cylinder (which is now usually a bit warmer than when first removed from the river). Finally, I consult a table to determine and record salinity (parts per thousand, or ppt).
Dissolved Oxygen
Measuring the amount of dissolved oxygen (DO) in my water sample is one of the most important tests I conduct -- especially significant in evaluating nutrient loading. I've learned that there are a variety of factors that contribute to the amount of oxygen dissolved in the water, including temperature, wind speed, wave action, and water column stratification. At higher temperatures, the solubility of oxygen is lower -- and there is also generally more biological activity, which consumes oxygen. In well-mixed waters, oxygen exchange with the atmosphere typically maintains high levels of dissolved oxygen in the waters. But in periods of extended calm, prolonged overcast, or heavy precipitation, the amount of dissolved oxygen declines. Dissolved oxygen in water is typically lowest between 6:00-9:00 AM, before photosynthesis makes up for nighttime oxygen removal. This is why our water quality monitoring always takes place during this early morning time window: we measure when DO is at its lowest point in the diurnal cycle.

Each 'Baywatcher' is provided with a Hach Kit Ox-2P for dissolved oxygen testing (using something called the "Azide modification of the Winckler method"). I pour a water sample from the 0.5-liter "oxygen" bottle into a round little glass bottle with a stopper. Then I add two pre-measured and individually-packaged powdered chemical reagents (#1 and #2, or Manganous Sulfate and Alkaline Potassium Iodide Azide, respectively), which react to form a white floc (Manganous Hydroxide). I cap the little bottle, shake vigorously for thirty seconds, let stand for two minutes, then shake again. The oxygen in the water converts the (manganous hydroxide) floc into a brownish (manganic hydroxide) solution. This doesn't look very appealing as your local river water.

Hach Kit for Dissolved Oxygen Testing, with the three pre-packaged chemical reagents.
This sample is already "fixed" and ready for transport.
This sample is already "fixed" and ready for transport.
After about five minutes, the chemical floc has settled and there is a clear division in the solution. Then I add a pre-measured packet of a third reagent, Sulfamic Acid powder, to convert the manganic hydroxide to manganic sulfate. This "fixes" the sample and makes it difficult for any additional oxygen to be introduced. It can now be transported. Meanwhile, the iodide in the solution is oxidized by the manganic sulfate, releasing iodine into the water (in an amount directly proportional to the amount of oxygen present in the original water sample), turning the solution a yellow-brown color. At this point, I usually pack up my stuff and high-tail it out of Dodge as quickly as I can, since the midges and "no-see-ums" have been viciously biting me this whole time.

Pour in precisely two small plastic tubey-thing-fuls....
Back at the house, I rinse off my waders and head to my workbench in the garage. Reopening the Hach kit, I uncap the little glass bottle and measure out a specific amount of the "fixed" water sample into a second, even smaller, square glass bottle. Then, using an eye-dropper, I add another solution (Sodium Thiosulfate), one drop at a time, and swirl the liquid in the smaller glass bottle for about ten seconds. The sodium thiosulfate reacts with the free iodine to produce Sodium Iodide. Then I add another drop, and repeat the swirling. I continue this again and again, as the color of the solution in the smaller bottle progressively fades, until all the iodine is has been converted and the yellow color disappears completely, leaving the liquid is clear and transparent.

Stand Back! I'm doing science....
I record the total of number of drops (of sodium thiosulfate) used to render the solution clear (1 drop = 0.5mg of O2/liter-ppm). I then consult an Oxygen Saturation Table to determine how many milligrams of oxygen were dissolved in the original water sample -- or simply divide the total number of drops by two to record Dissolved Oxygen ppm. If we ever find a value of less than 3mg/Liter, we are instructed to resample, retest, re-record, and to notify the Buzzards Bay Coalition offices immediately.

Solution rendered clear.
Pre-packaged chemical reagents array in foreground
Finally, I pour all the waste reagent solution(s) into a secure waste bottle, to be returned to the Buzzards Bay Coalition office for proper disposal. My lab work complete, I rinse all equipment using the faucet by the driveway. Inside the house, I double-check that my data entry is complete and accurate.

Last but not least, I fill out a Station Tracking Log in the back of my plastic binder.

Nutrient Sampling
But, Wait! There's More! I am also tasked with collecting additional fresh water samples, four times over the summer, from six different sites along the Weweantic River. These samples are sent to the Marine Biological Laboratory in Woods Hole for laboratory nutrient analysis. Specifically, they measure dissolved and particulate organic Nitrogen, Phosphate, Carbon/Nitrogen ratios, Nitrate + Nitrite, Ammonia, Phytoplankton and Chlorophyll content, and total Phosphorus / Dissolved Organic Carbon. WHOI charges the Buzzards Bay Coalition about $100 per nutrient sample analysis; I collect 24 nutrient samples over the course of the summer.

My nutrient sampling sites along the Weweantic. One of them requires me to go out in the boat to draw water.
These nutrient samples must be drawn during the last three hours of an outgoing tide, starting from the site farthest upriver and moving progressively towards the bay. In most cases, I either sample from the shore or wade out into the river. But my final site, WW5 at the river mouth, requires access by boat. I fill large brown bottles with river water, and then filter each sample into a smaller white bottle. Simply collecting the samples takes me more than two hours.

Nutrient Sampling Kit
First, I head off to my first site to draw a nutrient sample from the upstream side of the old Horseshoe Pond Dam across the Weweantic. I park in a small dirt lot in the woods and walk a short distance to the dam. While this is a beautiful area (with geocaches), there is also this creepy BMW that is often parked there too, tinted windows, motor running; other cars come and go without staying long, and I rarely see other people walk down to the dam. I suspect there are drug deals going down in that wooded parking area.


Filling a nutrient sample bottle
My second stop is a public-access boat ramp, at a rest area along I-195 in Wareham. To get here, I have to double back to Marion first and then head east again, this time on I-195.

Site WW6


Stop #3 is at the Rt. 6 Bridge over the Weweantic. I am supposed to take this sample from the middle of the river, but I cannot do that -- its too deep to wade, too shallow for my boat, and the bridge is too high for my sampling pole to reach the water from mid-span. So instead I climb down under the bridge and onto some slippery kelp-covered rocks for this sample. Since I can't reach out far enough into the water directly, I use the sampling pole to draw water and then transfer it to the brown nutrient sample bottle.

Then I get back in the car and head to my boat at Dexter's Cove. I row out, cast off, and motor downstream about a quarter-mile to my final sampling site at the mouth of the Weweantic. This is the most time-consuming sampling site. I thought about simply drawing my water sample from the dock and "fudging" the depth numbers to make it seem as if I took it from the proper location, but I am too honest to cheat science. If I am going to mess things up, it will be due to my careless stupidity, not to some nefarious scheming.

Once I get the boat back on the mooring, I drag the cooler (in which I keep the nutrient samples on ice) back to the house for filtering. I have to transfer 60cc of water from each of the four samples through a filter and into a smaller bottle.

First you draw 60cc from the brown sample bottle and push it through the filter and into the sink to rinse it (the filter, not the sink). Then you draw another 60cc and repeat that process, this time filling and rinsing the small white collection bottle. Only then do you draw yet another 60cc and re-fill the small white collection bottle with a sample of filtered water. The lab will analyze both the filtered and unfiltered samples.

I was rather surprised by the amount of microscopic particulate matter that was caught by the filters. The sample from the first site (WW0), at Horseshoe Pond Dam, had the most particulate matter. It was really hard to push that third syringe-ful of water through the filter (after the first two "rinses").


Finally, I pack up all my samples in the cooler with ice packs, include my Nutrient Sampling Data Sheet, and drive this over to the UMASS Cranberry Research Station in East Wareham. I drop it off there, and later in the afternoon someone from the Coalition comes by and picks it up to drive it (and all the samples) over to the MBL in Woods Hole.

Since its inception in 1992, the Buzzards Bay Citizen's Water Quality Monitoring Program has developed a comprehensive database on nutrient concentrations in harbors, coves, tributaries of Buzzards Bay. They provide a publicly-accessible "Bay Health Index" that measures the nutrient-related health of more than 75 harbors, coves, and rivers throughout the bay. The 0-100 index is based on five variables: oxygen saturation (0=40%, 100=90%); transparency (0=0.6m, 100=3m); chlorophyll (0=10ug/l, 100=3ug/l); DIN (0=10uM [0.14ppm], 100=1uM [0.014ppm]); and total organic nitrogen (0=43uM [0.6ppm], 100=20uM [0.28ppm]).
 Blue = GOOD, Yellow = FAIR, Red = POOR
(These data are from 2005, but you get the picture)
In 2003, the Coalition published its first quadrennial "State of the Bay" report, finding that the bay was functioning at half its ecological capacity (with a score of 48 out of 100). Half its harbors and coves were degraded by excessive nitrogen pollution. Septic systems and lawn fertilizers were major sources contributing to high levels of nitrogen loading. Coliform and pathogen contamination were also a problem (and not just from residential septic systems -- some boaters illegally discharge their holding tanks directly into the waters of the Bay). Four years later, the numbers continued to worsen, and the overall score for the Bay at 45. The 2011 report marked what seemed to be a halt to the bay's decline, with the overall score holding steady at 45.

RED = Shellfish Bed Closures, 2011
According to the Bay Health Index, the immediate embayment of my residence and boat mooring, the Outer Weweantic River (from my sample site near the Rt. 6 bridge to the river mouth) currently rates "Fair," with a score of 47 out of 100. Total nitrogen in its waters was down roughly one-third from a highpoint in 2013, algal pigments were less than half of what they had been in 2011, and you could see more than one meter down in the waters of the Outer Weweantic. However, farther upstream, above the Rt. 6 Bridge, the Inner Weweantic River rates "Poor," scoring only 33 out of 100 (but up from 28); nitrogen rates were higher, there were more algal pigments, and less than a half-meter visibility -- all of which remain concerns for downstream users. Nevertheless, as Studs Terkel put it, "Hope Dies Last."
According to the Bay Health Index, the immediate embayment of my residence and boat mooring, the Outer Weweantic River (from my sample site near the Rt. 6 bridge to the river mouth) currently rates "Fair," with a score of 47 out of 100. Total nitrogen in its waters was down roughly one-third from a highpoint in 2013, algal pigments were less than half of what they had been in 2011, and you could see more than one meter down in the waters of the Outer Weweantic. However, farther upstream, above the Rt. 6 Bridge, the Inner Weweantic River rates "Poor," scoring only 33 out of 100 (but up from 28); nitrogen rates were higher, there were more algal pigments, and less than a half-meter visibility -- all of which remain concerns for downstream users. Nevertheless, as Studs Terkel put it, "Hope Dies Last."

To Make America Great Again, It Takes a Village....
You can find a bunch of helpful suggestions at "What You Can Do" to help save Buzzards Bay.
It is a great website.. The Design looks very good.. Keep working like that!. glacier bay bathroom faucets
ReplyDelete